


Class 11
NCERT
Chapter 1: The Living World
11 questions
Chapter 2: Biological Classification
12 questions
Chapter 3: Plant Kingdom
12 questions
Chapter 4: Animal Kingdom
15 questions
Chapter 5: Morphology of Flowering Plants
15 questions
Chapter 6: Anatomy of Flowering Plants
12 questions
Chapter 7: Structural Organization in Animals
14 questions
Chapter 8: Cell: The Unit of Life
14 questions
Chapter 9: Biomolecules
15 questions
Chapter 10: Cell Cycle and Cell Division
16 questions
Chapter 11: Transport in Plants
16 questions
Chapter 12: Mineral Nutrition
10 questions
Chapter 13: Photosysnthesis in Higher Plants
9 questions
Chapter 14: Respiration in Plants
12 questions
Chapter 15: Plant Growth and Development
11 questions
Chapter 16: Digestion and Absorption
15 questions
Chapter 17: Breathing and Exchange of Gases
14 questions
Chapter 18: Body Fluids and Circulation
14 questions
Chapter 19: Excretory Products and their Elimination
12 questions
Chapter 20: Locomotion and Movement
10 questions
Chapter 21: Neural Control and Coordination
12 questions
Chapter 22: Chemical Coordination and Integration
9 questions
Solving time: 10 mins
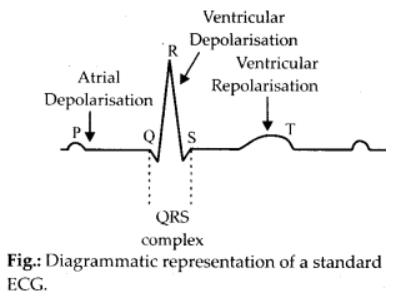
Draw a standard ECG and explain the different segments in it.
Views: 6,859 students
 Text solution
 Verified
The QRS Wave (complex) represents ventricular depolarisation (ventricular contraction). It is caused by the impulses of the contraction from AV node through the bundle of His and Purkinje fibres and the contraction of the ventricular muscles. Thus this wave is due to the spread of electrical impulse through the ventricles.
The T Wave represents ventricular repolarisation (ventricular relaxation). The potential generated by the recovery of the ventricle from the depolarisation state is called the repolarisation wave. The end of the T-wave marks the end of systole.
ECG gives accurate information about the heart. Therefore, ECG is of great diagnostic value in cardiac diseases.
Filo tutor solutions (1)
Learn from their 1-to-1 discussion with Filo tutors.
Uploaded on: 11/10/2022
Connect instantly with this tutor
Connect now
Taught by

Total classes on Filo by this tutor - 4,425
Teaches : Biology
Connect instantly with this tutor
Notes from this class (3 pages)


Practice more questions from Biology (NCERT)
Practice questions from Biology (NCERT)
Views: 5,837
Views: 6,244
Practice more questions from Body Fluids and Circulation
Views: 5,585
Practice questions on similar concepts asked by Filo students
Views: 5,665
Views: 5,851
Views: 5,362


Stuck on the question or explanation?
Connect with our Biology tutors online and get step by step solution of this question.


| Question Text | Draw a standard ECG and explain the different segments in it. |
| Updated On | Nov 10, 2022 |
| Topic | Body Fluids and Circulation |
| Subject | Biology |
| Class | Class 11 |
| Answer Type | Text solution:1 Video solution: 1 |
| Upvotes | 173 |
| Avg. Video Duration | 8 min |
