


Question
Medium
Solving time: 3 mins
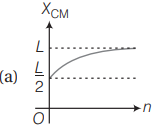
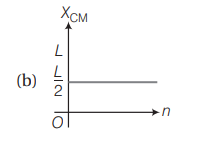
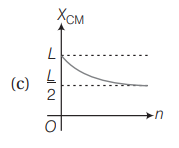
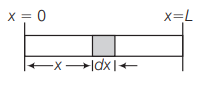
A thin rod of length is lying along the -axis with its ends at and . Its linear density (mass/length) varies with as , where can be zero or any positive number. If the position of the centre of mass of the rod is plotted against , which of the following graphs best approximates the dependence of on ?

Found 7 tutors discussing this question
Harper Discussed
A thin rod of length is lying along the -axis with its ends at and . Its linear density (mass/length) varies with as , where can be zero or any positive number. If the position of the centre of mass of the rod is plotted against , which of the following graphs best approximates the dependence of on ?
10 mins ago
Discuss this question LIVE
10 mins ago
 Text solution
 Verified
Exp. (a)
If n=0,then
As increases, the centre of mass shift away from towards which only option (a) is satisfying.
Alternately, you can use basic concept.
If n=0,then
As increases, the centre of mass shift away from towards which only option (a) is satisfying.
Alternately, you can use basic concept.
Was this solution helpful?
63
Share
Report
Filo tutor solutions (1)
Learn from their 1-to-1 discussion with Filo tutors.
10 mins
Uploaded on: 3/26/2022
Connect instantly with this tutor
Connect now
Taught by

Ritesh Raj
Total classes on Filo by this tutor - 2,316
Teaches : Physics, Organic Chemistry, Inorganic Chemistry
Connect instantly with this tutor
Was this solution helpful?
130
Share
Report

One destination to cover all your homework and assignment needs
Learn Practice Revision Succeed

Instant 1:1 help, 24x7
60, 000+ Expert tutors

Textbook solutions
Big idea maths, McGraw-Hill Education etc

Essay review
Get expert feedback on your essay

Schedule classes
High dosage tutoring from Dedicated 3 experts
Questions from JEE Mains 2008 - PYQs
Question 1
Easy
Views: 5,889
(a)
(b)
(c)
(d)
Question 2
Medium
Views: 5,122
Question 3
Medium
Views: 6,058
Practice questions from Arihant Physics JEE Main Chapterwise Solutions (2019-2002) (Arihant)
Question 1
Medium
Views: 6,088
Question 2
Medium
Views: 5,661
(a)
(b)
(c)
(d)
Question 3
Hard
Views: 6,190
(a)
(b)
(c)
(d)
Question 4
Medium
Views: 5,155
(a)
(b)
(c)
(d)
Practice questions from System of Particles and Rotational Motion in the same exam
Question 1
Medium
Views: 8,382
(a)
(b)
(c)
(d)
Question 2
Hard
Views: 5,351
(a)
(b)
(c)
(d)
Question 3
Easy
Views: 5,222
(a) solid sphere
(b) hollow sphere
(c) ring
(d) All same
Question 4
Medium
Views: 6,061
If the mass of the linear and circular portions of the badminton racket are same (M) and the mass of the threads are negligible, the moment of inertia of the racket about an axis perpendicular to the handle and in the plane of the ring at, distance from the end A of the handle will be .
Practice more questions from System of Particles and Rotational Motion
Question 1
Medium
Views: 6,163
Question 2
Easy
Views: 5,328
Question 3
Medium
Views: 5,950
Question 4
Medium
Views: 6,187
Practice questions on similar concepts asked by Filo students
Question 1
Views: 5,272
Question 2
Views: 5,882
Question 4
Views: 5,206


Stuck on the question or explanation?
Connect with our Physics tutors online and get step by step solution of this question.
231 students are taking LIVE classes


| Question Text | A thin rod of length is lying along the -axis with its ends at and . Its linear density (mass/length) varies with as , where can be zero or any positive number. If the position of the centre of mass of the rod is plotted against , which of the following graphs best approximates the dependence of on ? |
| Updated On | Mar 26, 2022 |
| Topic | System of Particles and Rotational Motion |
| Subject | Physics |
| Class | Class 11 |
| Answer Type | Text solution:1 Video solution: 1 |
| Upvotes | 193 |
| Avg. Video Duration | 10 min |
