


Question
Question asked by Filo student
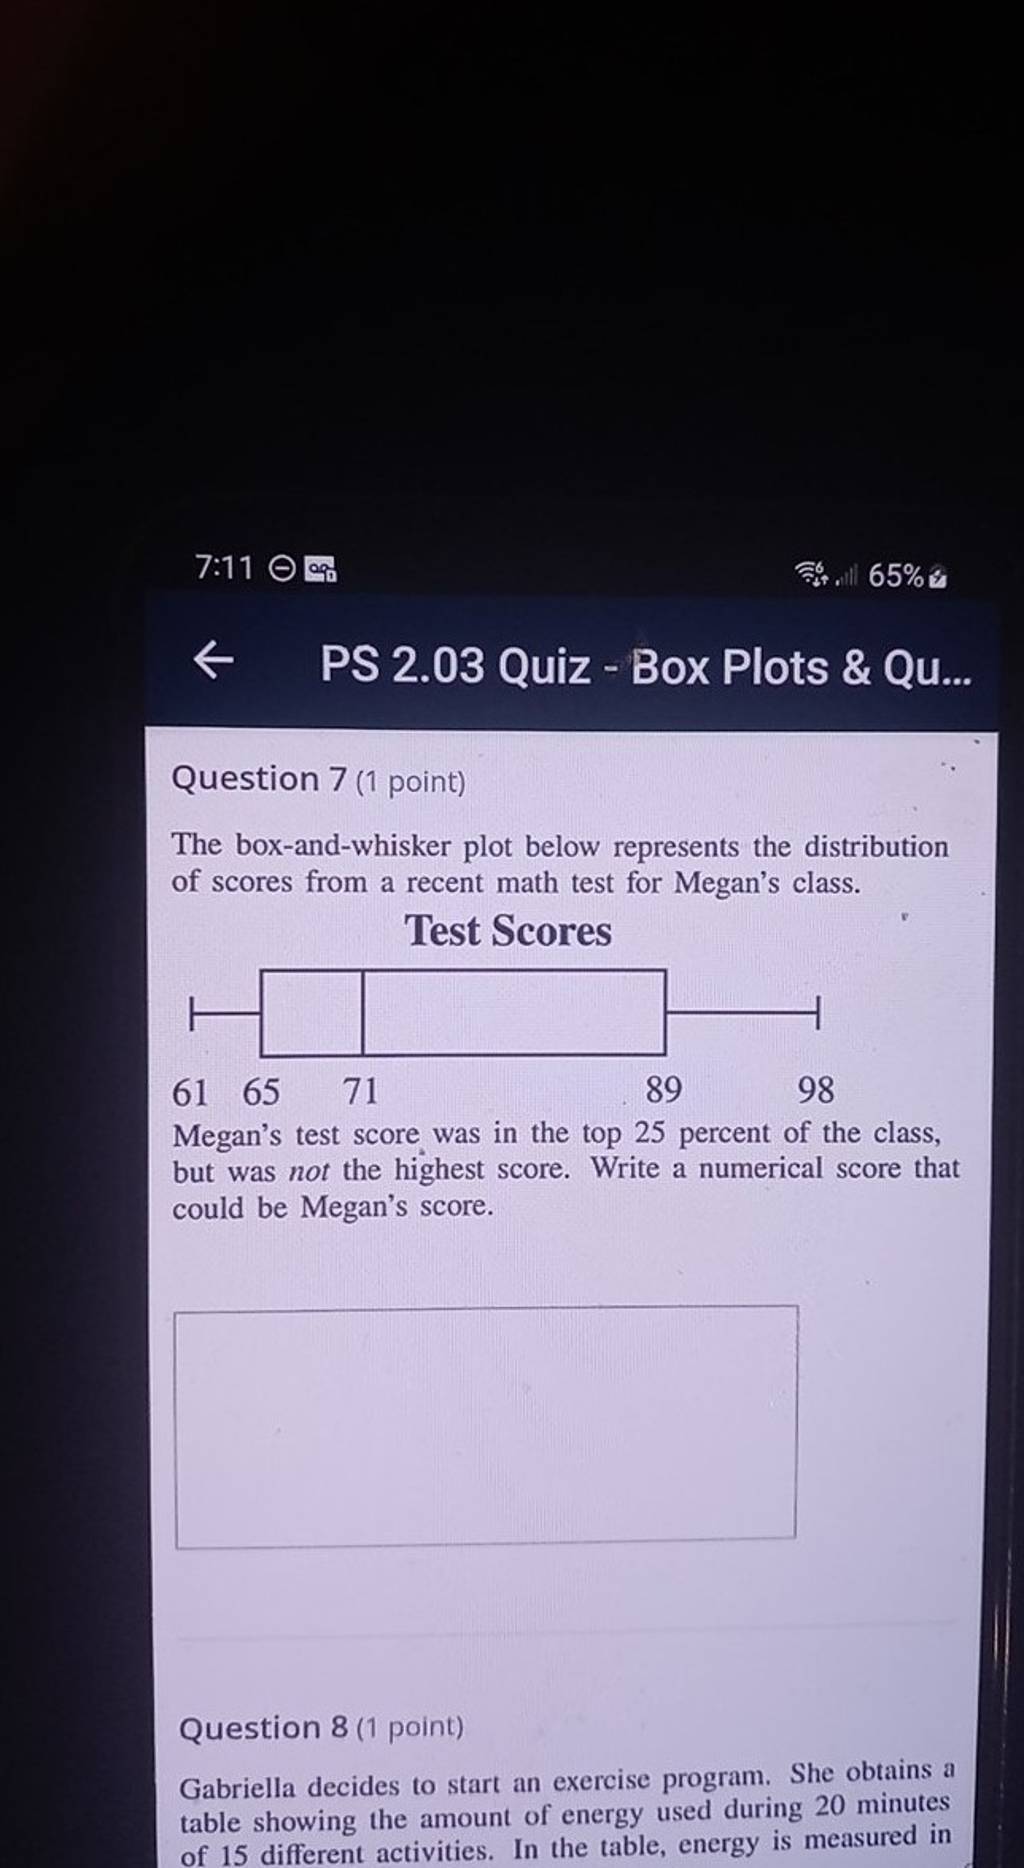
Question 7 (1 point) The box-and-whisker plot below represents the distribution of scores from a recent math test for Megan's class. Test Scores Megan's test score was in the top 25 percent of the class, but was not the highest score. Write a numerical score that could be Megan's score. Question 8 (1 point) Gabriella decides to start an exercise program. She obtains a table showing the amount of energy used during 20 minutes of 15 different activities. In the table, energy is measured in
Views: 5,391 students
Found 6 tutors discussing this question
Discuss this question LIVE
13 mins ago
Filo tutor solutions (1)
Learn from their 1-to-1 discussion with Filo tutors.
6 mins
Uploaded on: 2/20/2023
Connect instantly with this tutor
Connect now
Taught by

Abhishek Shukla
Total classes on Filo by this tutor - 1,591
Teaches : Statistics, Math, Algebra 1
Connect instantly with this tutor
Notes from this class (2 pages)

Was this solution helpful?
134
Share
Report

One destination to cover all your homework and assignment needs
Learn Practice Revision Succeed

Instant 1:1 help, 24x7
60, 000+ Expert tutors

Textbook solutions
Big idea maths, McGraw-Hill Education etc

Essay review
Get expert feedback on your essay

Schedule classes
High dosage tutoring from Dedicated 3 experts
Students who ask this question also asked
Question 1
Views: 5,810
Question 2
Views: 5,638
Question 3
Views: 5,317


Stuck on the question or explanation?
Connect with our Statistics tutors online and get step by step solution of this question.
231 students are taking LIVE classes
| Question Text |
Question 7 (1 point)
The box-and-whisker plot below represents the distribution of scores from a recent math test for Megan's class.
Test Scores
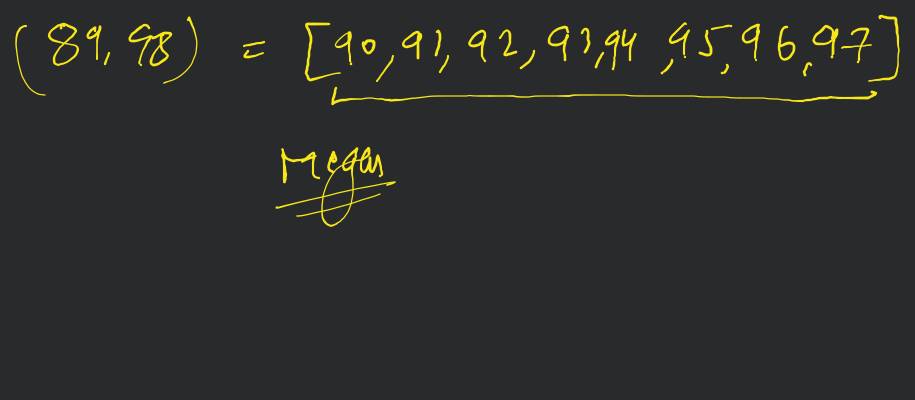
Megan's test score was in the top 25 percent of the class, but was not the highest score. Write a numerical score that could be Megan's score.
Question 8 (1 point)
Gabriella decides to start an exercise program. She obtains a table showing the amount of energy used during 20 minutes of 15 different activities. In the table, energy is measured in |
| Updated On | Feb 20, 2023 |
| Topic | Probability Concepts |
| Subject | Statistics |
| Class | High School |
| Answer Type | Video solution: 1 |
| Upvotes | 134 |
| Avg. Video Duration | 6 min |
