


Question
Question asked by Filo student
Use your new knowledge of functions and graphs to complete these questions, but don't use your calculator!
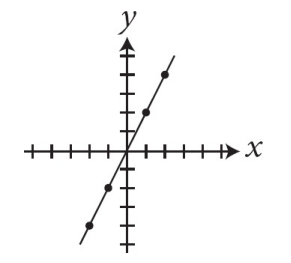
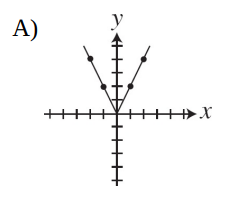
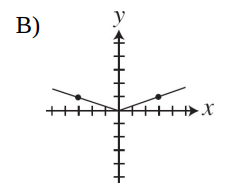
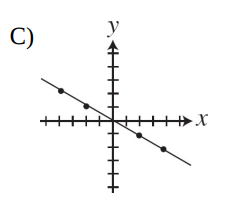
The graph above shows . Which of the following graphs represents
Views: 5,068 students
Found 5 tutors discussing this question
Emily Discussed
Use your new knowledge of functions and graphs to complete these questions, but don't use your calculator!
The graph above shows . Which of the following graphs represents
The graph above shows . Which of the following graphs represents
15 mins ago
Discuss this question LIVE
15 mins ago
 Text solution
 Verified
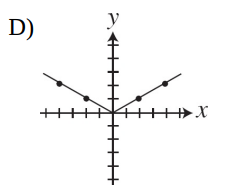
Try plugging in a value for to see if the graphs include that point. If , then , so should be a point on the graph. Unfortunately, this doesn't eliminate any answer choices; try another value. If , then , so should be a point on the graph. Eliminate (B), (C), and (D). The correct answer is (A).

One destination to cover all your homework and assignment needs
Learn Practice Revision Succeed

Instant 1:1 help, 24x7
60, 000+ Expert tutors

Textbook solutions
Big idea maths, McGraw-Hill Education etc

Essay review
Get expert feedback on your essay

Schedule classes
High dosage tutoring from Dedicated 3 experts
Students who ask this question also asked
Question 2
Views: 5,868
Question 3
Views: 5,456
Question 4
Views: 5,416
The figures above show the graphs of the functions and . The function is defined by . The function is defined by , where and are constants. What is the value of ?


Stuck on the question or explanation?
Connect with our Algebra 1 tutors online and get step by step solution of this question.
231 students are taking LIVE classes
| Question Text | Use your new knowledge of functions and graphs to complete these questions, but don't use your calculator! The graph above shows . Which of the following graphs represents |
| Topic | Functions |
| Subject | Algebra 1 |
| Class | High School |
| Answer Type | Text solution:1 |
