


Question
Question asked by Filo student
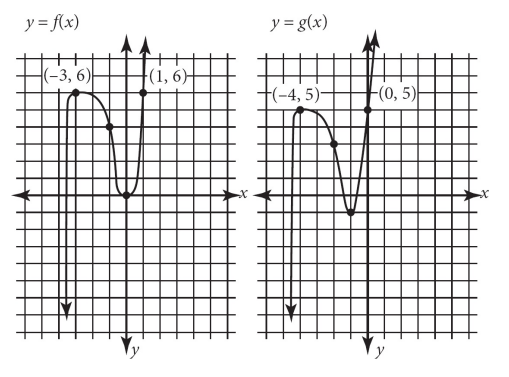
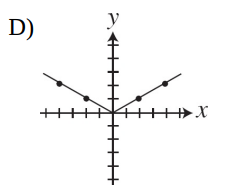
The figures above show the graphs of the functions and . The function is defined by . The function is defined by , where and are constants. What is the value of ?
- 0
- 1
Views: 5,417 students
Found 8 tutors discussing this question
Emily Discussed
The figures above show the graphs of the functions and . The function is defined by . The function is defined by , where and are constants. What is the value of ?
12 mins ago
Discuss this question LIVE
12 mins ago
 Text solution
 Verified
The second graph moves down 1 and to the left 1 . Remember that when a graph moves to the left, it is represented by , which would be the same as . So . Because a negative represents moving down, . Therefore, , and the correct answer is .

One destination to cover all your homework and assignment needs
Learn Practice Revision Succeed

Instant 1:1 help, 24x7
60, 000+ Expert tutors

Textbook solutions
Big idea maths, McGraw-Hill Education etc

Essay review
Get expert feedback on your essay

Schedule classes
High dosage tutoring from Dedicated 3 experts
Students who ask this question also asked
Question 2
Views: 5,067
The graph above shows . Which of the following graphs represents
Question 3
Views: 5,868


Stuck on the question or explanation?
Connect with our Algebra 1 tutors online and get step by step solution of this question.
231 students are taking LIVE classes
| Question Text | The figures above show the graphs of the functions and . The function is defined by . The function is defined by , where and are constants. What is the value of ? |
| Topic | Functions |
| Subject | Algebra 1 |
| Class | High School |
| Answer Type | Text solution:1 |
