


Question
Question asked by Filo student
A sample of gas follow process represented by = constant . Bulk modulus for this process is , then which of the following graph is correct ? a.  b.
b.  c.
c.  d.
d. 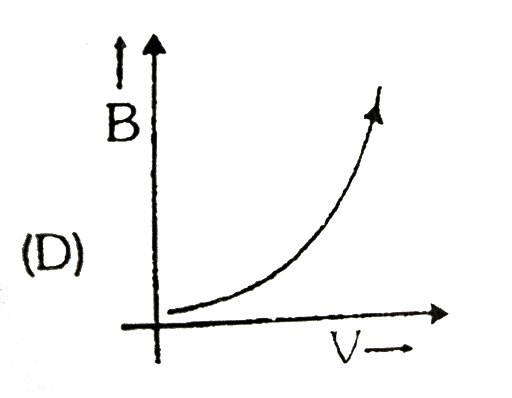
Views: 5,275 students
Found 6 tutors discussing this question
Asher Discussed
A sample of gas follow process represented by = constant . Bulk modulus for this process is , then which of the following graph is correct ? a.
b.
c.
d.
b.
c.
d. 13 mins ago
Discuss this question LIVE
13 mins ago
 Text solution
 Verified
Step 1: Use the relation
Step 2: Write the proportionality relation between pressure and volume
Step 3: Use the formula for percentage change
Step 4: Define bulk modulus
Step 5: Substitute the value of from step 3 in the above equation
Step 6: Use the ideal gas equation
and
Step 2: Write the proportionality relation between pressure and volume
Step 3: Use the formula for percentage change
Step 4: Define bulk modulus
Step 5: Substitute the value of from step 3 in the above equation
Step 6: Use the ideal gas equation
and

One destination to cover all your homework and assignment needs
Learn Practice Revision Succeed

Instant 1:1 help, 24x7
60, 000+ Expert tutors

Textbook solutions
Big idea maths, McGraw-Hill Education etc

Essay review
Get expert feedback on your essay

Schedule classes
High dosage tutoring from Dedicated 3 experts
Practice more questions on Geometrical and Physical Optics
Question 1
Hard
Views: 5,639
Question 2
Medium
Views: 6,085
Question 3
Medium
Views: 5,418
Question 4
Medium
Views: 6,121
Students who ask this question also asked
Question 1
Views: 5,931
Question 2
Views: 5,322
a. 40 cm b. 20 cm c. 42.2 cm d. 60 cm
Question 3
Views: 5,746
Question 4
Views: 5,219


Stuck on the question or explanation?
Connect with our Physics tutors online and get step by step solution of this question.
231 students are taking LIVE classes
| Question Text | A sample of gas follow process represented by = constant . Bulk modulus for this process is , then which of the following graph is correct ? a.
b.
c.
d.
|
| Topic | Geometrical and Physical Optics |
| Subject | Physics |
| Class | Class 12 |
| Answer Type | Text solution:1 |
