


Question
Medium
Solving time: 3 mins
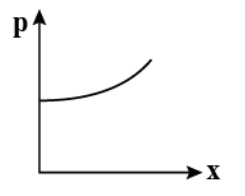
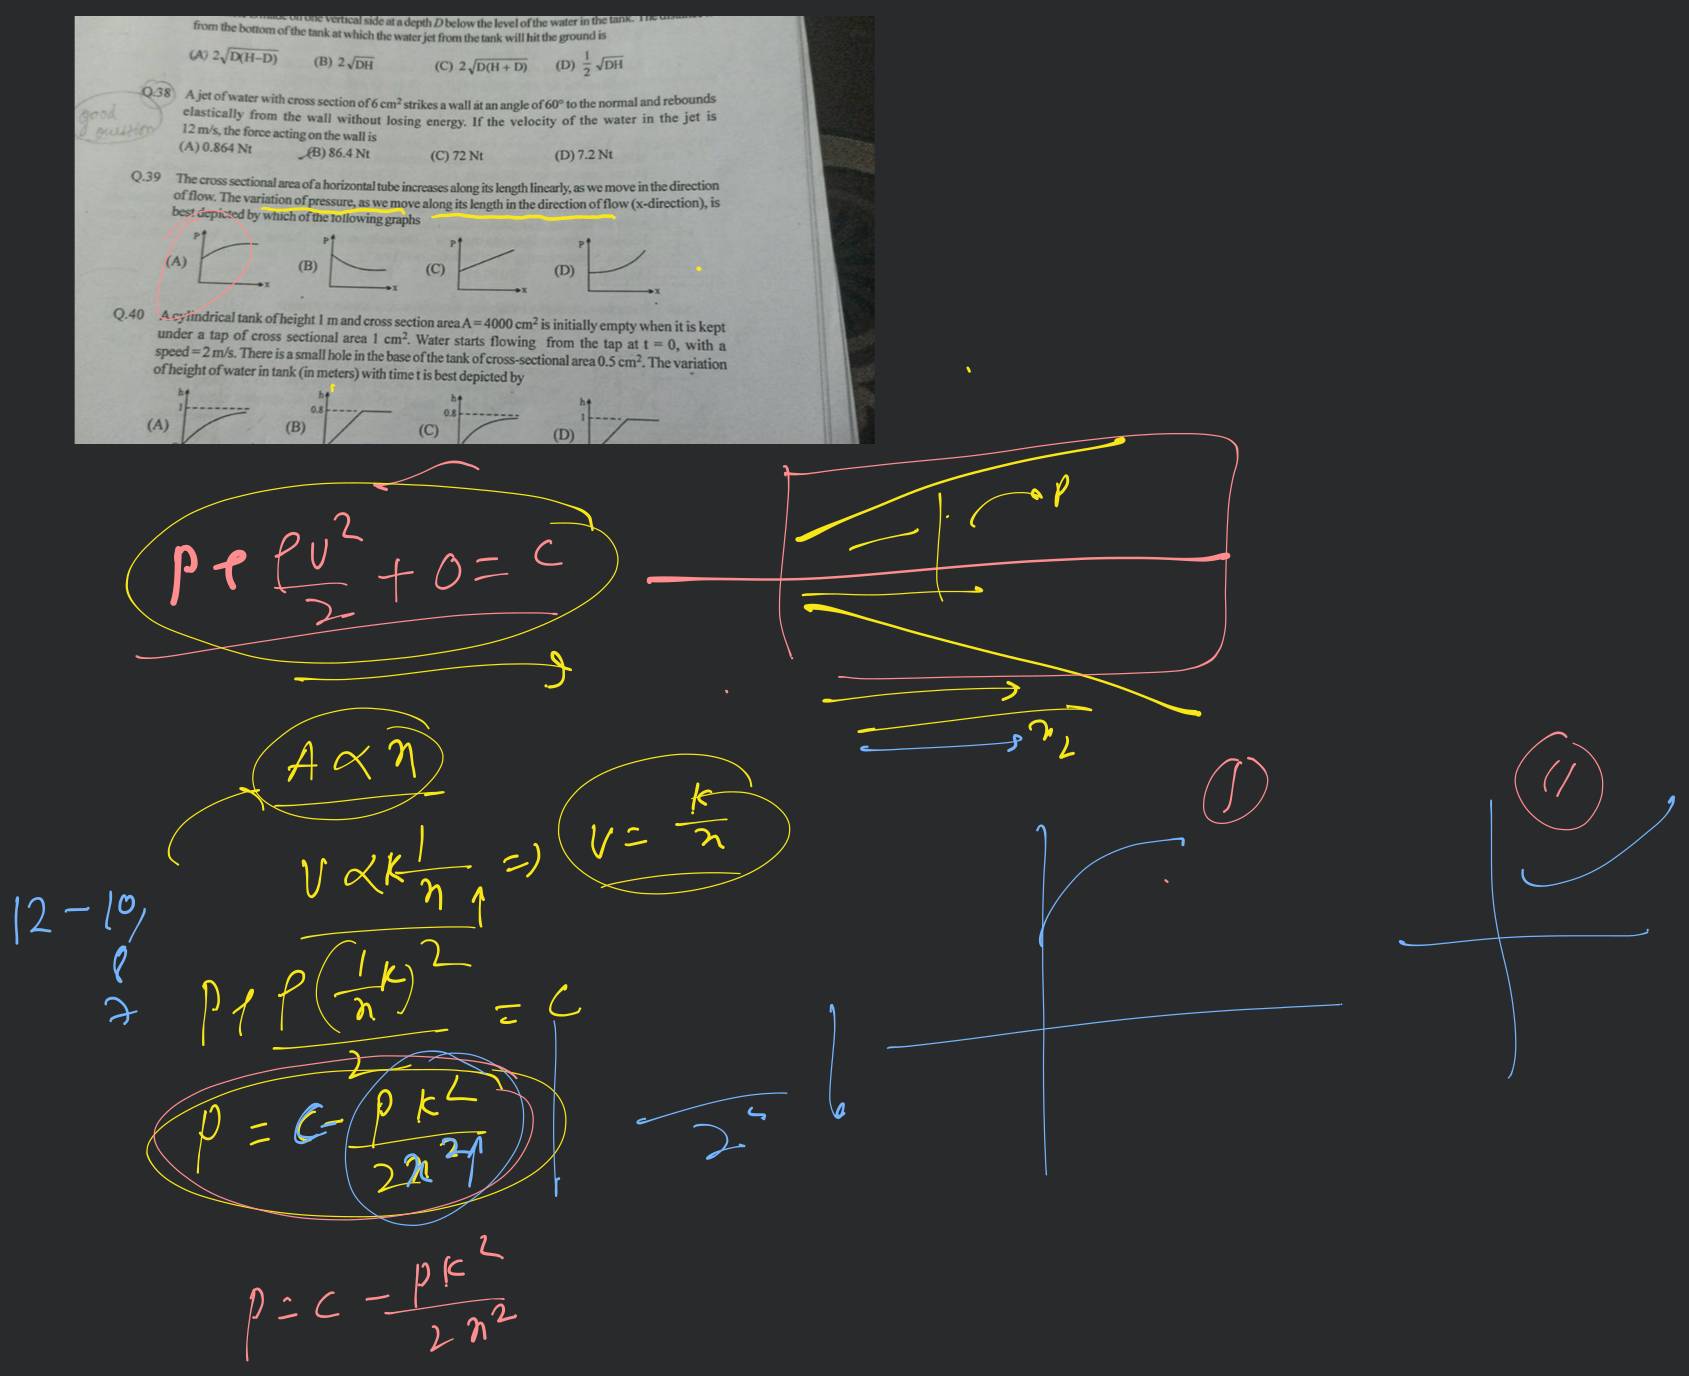
The cross sectional area of a horizontal tube increases along its length linearly, as we move in the direction of flow. The variation of pressure, as we move along its length in the direction of flow (x-direction), is best depicted by which of the following graphs.
A

B

C

D
Views: 5,837 students
Found 8 tutors discussing this question
Discuss this question LIVE
14 mins ago
 Text solution
 Verified
Continuity equation states that the product of area of cross section and velocity remains constant
The graph of area v/s will be a straight line with positive slope
Accordingly the area of velocity v/s will be a hyperbola
Pressure and velocity are related by Bernoulli's equation as
The graph for Velocity squared v/s is a second degree hyperbola; visually, it's just like a hyperbola curve
Now, the graph for a constant v/s is a horizontal straight line, thus the curve for pressure will be mirror image of the hyperbola curve about the horizontal straight line
Was this solution helpful?
139
Share
Report
Filo tutor solutions (1)
Learn from their 1-to-1 discussion with Filo tutors.
6 mins
Uploaded on: 3/14/2023
Connect instantly with this tutor
Connect now
Taught by

Deepak Kumar Sah
Total classes on Filo by this tutor - 9,657
Teaches : Physics, Mathematics
Connect instantly with this tutor
Notes from this class (1 pages)
Was this solution helpful?
91
Share
Report

One destination to cover all your homework and assignment needs
Learn Practice Revision Succeed

Instant 1:1 help, 24x7
60, 000+ Expert tutors

Textbook solutions
Big idea maths, McGraw-Hill Education etc

Essay review
Get expert feedback on your essay

Schedule classes
High dosage tutoring from Dedicated 3 experts
Practice more questions from Mechanical Properties of Fluids
Question 1
Medium
Views: 5,874
Question 2
Medium
Views: 5,654
Question 3
Easy
Views: 5,761
Question 4
Easy
Views: 5,799
[Take surface tension of water , angle of contact and density of water ]
Practice questions on similar concepts asked by Filo students
Question 2
Views: 5,235
Question 3
Views: 5,395


Stuck on the question or explanation?
Connect with our Physics tutors online and get step by step solution of this question.
231 students are taking LIVE classes


| Question Text | The cross sectional area of a horizontal tube increases along its length linearly, as we move in the direction of flow. The variation of pressure, as we move along its length in the direction of flow (x-direction), is best depicted by which of the following graphs. |
| Updated On | Mar 14, 2023 |
| Topic | Mechanical Properties of Fluids |
| Subject | Physics |
| Class | Class 11 |
| Answer Type | Text solution:1 Video solution: 1 |
| Upvotes | 230 |
| Avg. Video Duration | 6 min |
