


Question
Medium
Solving time: 3 mins
In an experiment, electrons are made to pass through a narrow slit of width d comparable to their de-Broglie wavelength. They are detected on a screen at a distance D from the slit (see figure).

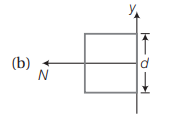
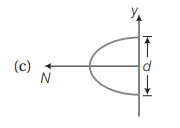
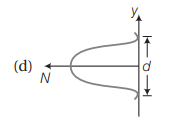
Which of the following graphs can be expected to represent the number of electrons N detected as a function of the detector position y y( = 0 corresponds to the middle of the slit) ?

Found 8 tutors discussing this question
Mateo Discussed
In an experiment, electrons are made to pass through a narrow slit of width d comparable to their de-Broglie wavelength. They are detected on a screen at a distance D from the slit (see figure).
Which of the following graphs can be expected to represent the number of electrons N detected as a function of the detector position y y( = 0 corresponds to the middle of the slit) ?
Which of the following graphs can be expected to represent the number of electrons N detected as a function of the detector position y y( = 0 corresponds to the middle of the slit) ?
10 mins ago
Discuss this question LIVE
10 mins ago
 Text solution
 Verified
Exp. (d)
As diffraction pattern has to be wider than slit width, so (d) is the correct option.
As diffraction pattern has to be wider than slit width, so (d) is the correct option.
Was this solution helpful?
112
Share
Report

One destination to cover all your homework and assignment needs
Learn Practice Revision Succeed

Instant 1:1 help, 24x7
60, 000+ Expert tutors

Textbook solutions
Big idea maths, McGraw-Hill Education etc

Essay review
Get expert feedback on your essay

Schedule classes
High dosage tutoring from Dedicated 3 experts
Questions from JEE Mains 2008 - PYQs
Question 1
Easy
Views: 5,396
(a)
(b)
(c)
(d)
Question 2
Medium
Views: 5,815
Question 3
Medium
Views: 5,350
What are number of nuclei of , when number of nuclei of and are equal?
(a)
(b)
(c)
(d)
Question 4
Medium
Views: 5,516
(a)
(b)
(c)
(d)
Practice questions from Arihant Physics JEE Main Chapterwise Solutions (2019-2002) (Arihant)
Question 2
Easy
Views: 5,812
Question 3
Medium
Views: 5,383
Question 4
Medium
Views: 6,041
Practice questions from Wave Optics in the same exam
Question 1
Easy
Views: 5,483
Practice more questions from Wave Optics
Question 1
Hard
Views: 5,818
Question 2
Medium
Views: 5,610


Question 3
Medium
Views: 5,982
Question 4
Medium
Views: 5,465
Practice questions on similar concepts asked by Filo students
Question 1
Views: 5,398
Question 2
Views: 5,153
Question 3
Views: 5,361


Stuck on the question or explanation?
Connect with our Physics tutors online and get step by step solution of this question.
231 students are taking LIVE classes


| Question Text | In an experiment, electrons are made to pass through a narrow slit of width d comparable to their de-Broglie wavelength. They are detected on a screen at a distance D from the slit (see figure). Which of the following graphs can be expected to represent the number of electrons N detected as a function of the detector position y y( = 0 corresponds to the middle of the slit) ? |
| Topic | Wave Optics |
| Subject | Physics |
| Class | Class 12 |
| Answer Type | Text solution:1 |
| Upvotes | 112 |
